Loading Audio Data
NWaveDataGen converts a folder of .wav files into spike-compatible, time-binned
features ready for the nwave hardware frontend.
Expected folder structure:
data_for_nwave_commands/
├── yes/
│   ├── sample_001.wav
│   └── ...
└── no/
    ├── sample_001.wav
    └── ...
Each subdirectory is a class label. NWaveDataGen handles resampling, padding/trimming,
and applying the H1 hardware filter bank.
import torch
import matplotlib.pyplot as plt
from nwavesdk import NWaveDataGen, NWaveDataloaderConfig
data_config = NWaveDataloaderConfig(
    batch_size=16,
    val_split=0.2,
    test_split=0.0,
    shuffle_train=True,
    random_state=42,
    num_workers=2,
)

dm = NWaveDataGen(
    data_parent="../data_for_nwave_commands",  # one subfolder per class
    sample_rate=16000,
    recording_duration_s=1.0,    # pad/trim all clips to 1 second
    sim_time_s=8e-3,             # 8 ms time bins → 125 timesteps for a 1-second clip
    dataloader_config=data_config,
    task="classification",
    return_filename=False,
)

loaders = dm.dataloaders()
train_loader = loaders["train"]
val_loader   = loaders["val"]

print(f"Train batches: {len(train_loader)}")
print(f"Val   batches: {len(val_loader)}")
2026-05-20 09:21:40,995 - root - WARNING - Using 13 valid freqs out of 16 for sr=16000Hz (Nyquist=8000.0Hz).


Classes (loading wavs):   0%|          | 0/2 [00:00<?, ?it/s]


Loading no:   0%|          | 0/3536 [00:00<?, ?it/s]


Loading yes:   0%|          | 0/3625 [00:00<?, ?it/s]


Filtering no:   0%|          | 0/3536 [00:00<?, ?it/s]


Filtering yes:   0%|          | 0/3625 [00:00<?, ?it/s]


Train batches: 359
Val   batches: 90
x, y = next(iter(train_loader))
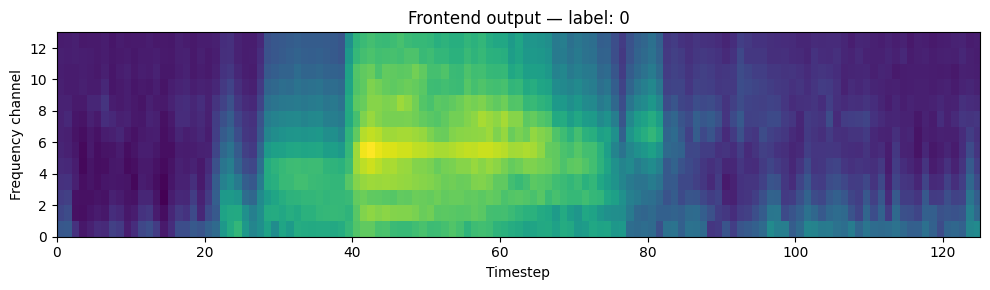
# Visualise the filter-bank output for the first sample: frequency channels over time.
sample = x[0].T.numpy()  # (frequency_channels, timesteps)

fig, ax = plt.subplots(figsize=(10, 3))
ax.imshow(sample, aspect="auto", origin="lower", interpolation="nearest",
          extent=[0, x.shape[1], 0, x.shape[2]])
ax.set_xlabel("Timestep")
ax.set_ylabel("Frequency channel")
ax.set_title(f"Frontend output — label: {y[0].item()}")
plt.tight_layout()
plt.show()
Further reading
- Reference → Data Preparation: full
NWaveDataloaderConfigparameter reference and preprocessing pipeline →../data-prep/formats.md - Tutorial 4 — audio classification on H1v1 with full training loop →
../tutorials/Tutorial4_audio_classification_on_H1v1.md - Tutorial 5 — same with automatic initialization →
../tutorials/Tutorial5_audio_classification_on_H1v1_auto_init.md - Tutorial 6 — audio classification on H1v2 →
../tutorials/Tutorial6_audio_classification_on_H1v2.md